Research Article
Development and Validation of Spectroscopic Method for Determination of L- Ornithine L-Aspartate in Commercial Dosage Form
- Dr. Ashish Sarkar
Corresponding author: Dr. Ashish Sarkar, Dean School of Pharmacy YBN University Ranchi- Jharkhand-834010.
Volume: 2
Issue: 6
Article Information
Article Type : Research Article
Citation : Rubel Mondal, Dr. Ashish Sarkar. Development and Validation of Spectroscopic Method for Determination of L- Ornithine L-Aspartate in Commercial Dosage Form. Journal of Medical and Clinical Case Reports 2(6). https://doi.org/10.61615/JMCCR/2025/OCT027141011
Copyright: © 2025 Dr. Ashish Sarkar. This is an open-access article distributed under the terms of the Creative Commons Attribution License, which permits unrestricted use, distribution, and reproduction in any medium, provided the original author and source are credited.
DOI: https://doi.org/10.61615/JMCCR/2025/OCT027141011
Publication History
Received Date
19 Sep ,2025
Accepted Date
06 Oct ,2025
Published Date
11 Oct ,2025
Abstract
Utilizing a spectrophotometric technique that was not only simple to use but also shown to be accurate, the levels of both pure L-ornithine L-aspartate and commercial dosage formulations were determined. The technique calls for the use of alkaline potassium permanganate in order to oxidize L-ornithine L-aspartate at room temperature, which is defined as 30 ± 2 °C. Monitoring of the reaction's development was accomplished using spectrophotometry, which included observing the increase in absorbance at a wavelength of 610 nm. The beginning rate technique, in addition to the fixed-time method (the latter of which used a ten-minute time period), was employed in the creation of calibration curves. The approach was validated in accordance with the International Conference on Harmonization (ICH) guidelines on linearity, precision, accuracy, and reproducibility, and experimental variables were changed accordingly. In accordance with Beer's law, the method exhibited outstanding linearity over the concentration range of 5–60 µg/ml. The initial rate regression equation was found to be log A = 2.566 + 0.988 log C, whereas the fixed-time method's regression equation was A = −3.34 × 10⁻² + 0.02833 C. We successfully used the recommended spectrophotometric method to accurately measure L-ornithine L-aspartate in commercial dosage forms, thus demonstrating that it is a good candidate for routine quality control analysis.
Keywords: L-ornithine L-aspartate, spectrophotometric method, potassium permanganate, method development, validation, ICH guidelines, Beer’s law, commercial dosage form, kinetic method, fixed-time method
►Development and Validation of Spectroscopic Method for Determination of L- Ornithine L-Aspartate in Commercial Dosage Form
Rubel Mondal1, Dr. Ashish Sarkar2*
1PG Scholar, School of Pharmacy, YBN University.
2Dean School of Pharmacy, YBN University, Ranchi-Jharkhand-834010.
Introduction
A molecule of ornithine L-aspartate (LOLA), which is a stable salt, is produced by mixing the amino acids ornithine and aspartic acid together. It is widely used in clinical practice as a treatment for hepatic encephalopathy and other liver illnesses because it assists in the detoxification of ammonia and enhances hepatic function in the urea cycle [1]. There are a number of different commercial dosage forms of LOLA, including tablets, syrups, and injections. These dosage forms are employed for the medicinal, hepatoprotective, and nutritional benefits that LOLA provides [2].
Need for Analytical Method Development
In order to ensure product quality, therapeutic efficacy, and patient safety, it is of utmost importance to precisely measure L-Ornithine L-Aspartate in pharmaceutical formulations. Examples of conventional analytical techniques include titrimetric analysis as well as chromatographic processes such as high-performance liquid chromatography (HPLC) and liquid chromatography-mass spectrometry (LC-MS). However, these approaches may be time-consuming, costly, and require a lot of apparatus [3]. As a result, regular quality control laboratories are making a greater effort to find spectrophotometric processes that are simple to use, fast, and affordable.
Role of Spectrophotometry in Drug Analysis
Due to the fact that ultraviolet-visible spectrophotometry requires little sample preparation, is simple to use, and is sensitive and accurate, it has become one of the most common procedures employed in the field of pharmaceutical analysis [4]. Spectroscopic methods may be used as effective alternatives to more advanced techniques and provide valid analytical data, provided that they are confirmed in accordance with the standards of the International Council for Harmonisation of Technical standards for Pharmaceuticals for Human Use (ICH). For L-ornithine L-aspartate, oxidation-based spectrophotometric techniques that use reagents such as alkaline potassium permanganate are a promising option for the routine measurement of commercial formulations.
Objectives
- To provide a straightforward, precise, and economical spectrophotometric technique for identifying L-ornithine L-aspartate in commercial dosage forms.
- To confirm that the proposed technique satisfies ICH criteria for metrics, including linearity, accuracy, precision, LOD, and LOQ.
Material And Method
For the purpose of spectrophotometric measurements, the studies were carried out with the use of quartz cells that were identical to one another in a Shimadzu UV-visible spectrophotometer.
Standards and Reagents
The following solutions were prepared in distilled water: 1.0 M sodium hydroxide (GR Grade, Merck Limited, Mumbai, India) and 0.9 × 10⁻³ M potassium permanganate (GR Grade, Merck Limited, Mumbai, India). It is essential to make use of a titrimetric method in order to standardize the apparent purity of the potassium permanganate solution, as well as to produce the solution in a fresh manner [5]. A standard solution of Milli Q water containing 0.05% L-ornithine-L-aspartate was prepared.
Method for Calculating L-Ornithine-L-Aspartate
1. Initial Rate Method
Aliquots with volumes between 0.1 and 1.2 milliliters were pipetted into a number of ten-milliliter standard flasks containing 0.05 percent L-ornithine-L-aspartate. Following that, two different solutions were added one after the other to each of the flasks: two milliliters of a solution that contained 0.010 x 10⁻³ moles of potassium permanganate and 1.8 milliliters of a solution that had one mole of sodium hydroxide. The solutions were diluted to the mark using Milli Q water at a temperature of 30 ± 2 °C. We were able to keep track of the increase in absorbance at 610 nanometers over time by carefully blending the contents of each flask. To begin, we calculated the tangent slope of the absorbance-time plot in order to determine the initial reaction rate at a variety of different concentrations. We plotted the initial reaction rate against the molar concentration of L-ornithine-L-aspartate in order to generate the calibration plots. The dose was calculated by using either the calibration graph or the regression equation.
2. Fixed Time Method
Ten minutes in length is the predetermined and established length of time for this method. The absorbance of the samples of the drug solution was measured at 610 nm at the time indicated, and the results were compared to those of a reagent blank that had been prepared in the same manner as the drug solution samples but had not been given the drug. The calibration curve was generated by the comparison of the absorbance and the initial concentration of L-ornithine L-aspartate. The amount of the medication that should be administered may be calculated by making use of a calibration curve or a regression equation.
L-Ornithine-L-Aspartate Determination in Injection Formulation
A five-gram-per-ten-milliliter ampoule of L-ornithine-L-aspartate was the substance that was used for this investigation. A final solution that is equivalent to the standard solution and has a concentration of 0.05 percent was obtained by dissolving one milliliter of Satmax in one liter of milli Q water. One of the two recommended methods was used to test five to sixty grams of L-ornithine L-aspartate, which had been diluted to the appropriate drug concentration and placed in a ten-milliliter conical flask.
Method for Determining L-Ornithine-L-Aspartate in Synthetic Blends
The applicability of the newly developed technique has been validated, and earlier applications of synthetic mixtures have been carried out in order to quantitatively examine therapeutic compounds [6, 7]. The purpose of the proposed method is to calculate the amount of L-ornithine L-aspartae present in both pure and dosage forms. L-ornithine-L-aspartate was not accessible on the local market in the form of a pill; thus, a synthetic mixture was created by combining L-ornithine-L-aspartate with a placebo. After that, this combination was put through the process of determination. A combination of L-ornithine and L-aspartate was manufactured using excipients that are commonly present in solid dosage forms, and the mixture was then assessed in order to examine the feasibility of the recommended processes in the form of a tablet. The synthetic cocktail was created by adding the following ingredients: 100 milligrams (mg) of glucose, 100 mg of L-ornithine L-aspartate, 280 mg of lactose, 40 mg of silicon dioxide, 360 mg of maize starch, and 25 mg of magnesium stearate. In the synthesized combination, the mass ratio of L-ornithine L-aspartae to lactose, silicon dioxide, glucose, and magnesium stearate was 1:0.8:0.4:3.6:1:0.25, respectively. Magnesium stearate, lactose, soybean starch, silicon dioxide, and glucose are the components that are used to make the placebo. For measurement, a portion of the synthetic mixture, consisting of 5–60 grams of L-ornithine L-aspartate and a placebo, was transferred to a 10 milliliter conical flask. This was accomplished by using one of the two proposed methods.
Result And Discussion
Spectral Analysis
Figure 1 shows the absorption spectra of the green manganate ion (c), a blank solution (b), and pure medicine (a). Figure 1 displays the alteration that occurred in the absorption spectra.
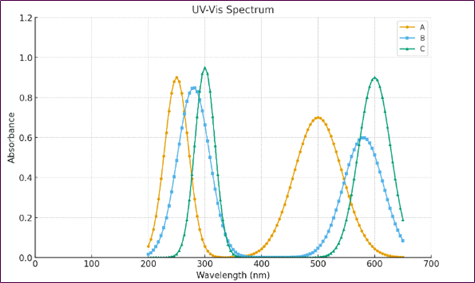
Fig. 1. Spectra of absorption for (A) Milli Q water with 1.13×10⁻⁴ M L-ornithine-L-aspartate. (B) One 8 × 10⁻² M NaOH plus 1.8 × 10⁻³ M KMnO4. (C) 1.88 × 10⁻² M NaOH + 2.26 × 10⁻⁴ M Lornithin L-aspartate (green product) + 1.8 × 10⁻³ M KMnO4.
Table 1. Analytical Information and Optical Properties
|
Parameters |
Initial Rate Method |
Fixed Time Method |
|
Linear dynamic range (µg/ml) |
5 – 60 |
5 – 60 |
|
Regression equation |
log A = 2.566 + 0.988 log C |
A = –3.34 × 10⁻² + 0.02833C |
|
Correlation coefficient (r) |
0.9982 |
0.9976 |
|
Sa (Standard deviation of intercept) |
1.06 × 10⁻¹ |
2.97 × 10⁻² |
|
Sb (Standard deviation of slope) |
2.64 × 10⁻² |
7.58 × 10⁻⁴ |
|
Limit of detection (LOD, µg/ml) |
0.083 |
0.604 |
|
Limit of quantitation (LOQ, µg/ml) |
0.251 |
1.831 |
The absorbance bands that are evident in the aqueous solution of L-ornithine L-aspartate are 212 nanometers and 243 nanometers, respectively. However, the alkaline potassium permanganate solution has a noticeable absorbance band at 530 nanometers. The addition of L-ornithine-L-aspartate to an aqueous solution of potassium permanganate that is alkaline initiates an oxidation process. This creates a shift in the absorption band; spectral investigations of green products found two maximum absorbances, one at 602 nanometers and the other at 610 nanometers. According to previously published studies [8, 9], the presence of manganate ions is responsible for the green coloration, as shown by the prior research. The intensity of the colorful product increases with time as a consequence of the oxidation of L-ornithine-L-aspartate. It takes around seventy-five minutes for the whole procedure to reach the state of equilibrium.
This resulted in the adoption of two approaches for the purpose of drug estimation: the initial rate technique and the fixed time method. Even though two peaks were seen, the drug was examined at a wavelength of 610 nanometers since it was the wavelength at which the absorption was at its maximum level. The recommended methods' analytical data and optical properties are presented in Table I. The L-ornithine-L-aspartate moiety has two functional groups: the -NH2 group and the -COOH group, as can be seen from its structure. Of the two functional groups, the group with the -NH2 functional group is more reactive than the group with the -COOH functional group. For this reason, the -NH2 group will participate in the process of oxidation. The most probable pathway for the oxidation of L-ornithine-L-aspartate is shown in Figure 2.
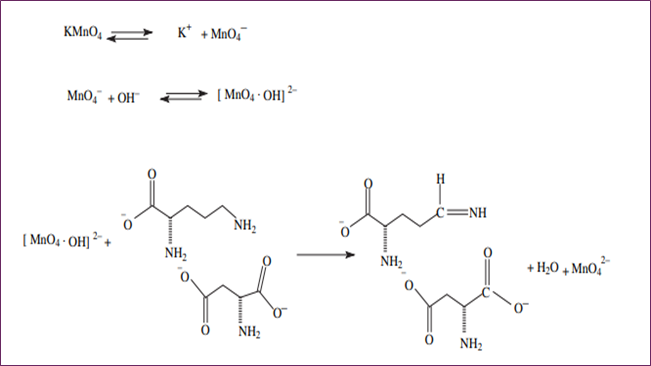
Figure 2. The likely mechanism by which L-ornithine-L-aspartate oxidizes.
Variable Optimization
We maintained the ideal circumstances for the operations responsible for the generation of green magnate ions and conducted research throughout the experiment. We looked at how the beginning rate of the reaction was impacted by variations in the concentration of the KMnO4 within the suggested range. As the amount of KMnO4 grew, the absorbance climbed from 0.1 ml to 1.9 ml and then stayed constant until it reached 2.3 ml. This suggests that the initial reaction rate was raised as the volume of KMnO4 (9 0 × 10−3) increased. As seen in Figure 2, the ideal amount is 2.0 milliliters. During the optimization experiment, it was also observed that increasing the volume of 1.0 M NaOH led to an increase in absorbance; this trend continued from 0.1 ml to 1.5 ml. Beyond this point, increasing the concentration of NaOH had no effect on the initial reaction rate, so the optimal volume for the method development process was chosen to be 1.8 ml (Fig. 4).
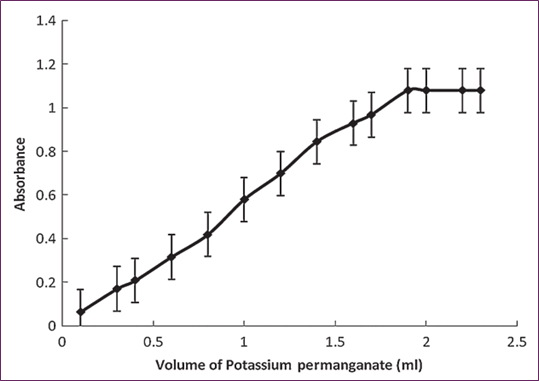
Fig. 3. Effect of potassium permanganate (0.009 M) volume while maintaining L-ornithin L-aspartate (2.26×10⁻⁴ M) and NaOH (2.0 × 10⁻¹ M) concentrations constant.
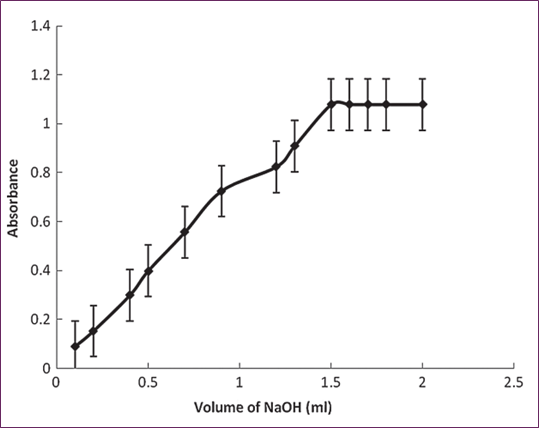
Fig. 4. Impact of NaOH (0.1 M) Volume while Maintaining KMNO4 (1.8 × 10⁻³ M) and L-Ornithin L-Aspartate (2.26 × 10⁻⁴ M) Concentrations Constant.
Validation of Methods and Analytical Parameters
As the technique was being developed, the kinetic measurements were performed at a temperature of thirty degrees Celsius, give or take two degrees, under pseudo-first-order conditions. The absorbance-time graphs shown in Figure 4 were used in the calculation of the rates of the first reactions. As shown in Table II, the results are reported there, and the slopes of the first tangent to the absorbance-time curves were measured. The following kinetic equation is used to determine the rate at which potassium permanganate oxidizes L-ornithine-L-aspartate in an alkaline environment:
 (1)
(1)

Thereby, Equation (1) was simplified to
 (2)
(2)
The order of reaction, C, is the concentration of L-ornithine-L-aspartate, and k† is the pseudo-order rate constant
When expressed in logarithmic form, the equation becomes as
 (3)
(3)
Under ideal experimental conditions, the starting rate as a function of concentration graph followed Beer's law in the range between 5 and 60 g/ml. By displaying the beginning rate as a function of concentration, we may get the following linear regression equation:

The coefficient of correlation (r) for the first rate versus concentration plot was found to be equal to 0.9982. A line graph showing the relationship between the logarithm of the initial rate of reaction (log C) and the logarithm of the molar concentration of L-ornithine-L-aspartate (log C) was plotted. This was done in order to determine the order of the reaction with respect to L-ornithine-L-aspartate, and the conclusion reached was that the order of the reaction was unity [10]. In light of this, the pseudo-first-order reaction and equation would be applicable to the process of oxidizing L-ornithineL-aspartate. The connection b ± tSb was used to create the confidence limits for the slope of the regression line, and the relation a ± tSa was used to construct the confidence limits for the intercept of the regression line. These relations were employed at a 95 percent confidence level. The limit of quantitation (LOQ) and the limit of detection (LOD) were calculated by applying the following equation to statistical treatment data at seven different concentration levels.

where b is the slope of the calibration line and S0 is its standard deviation.
Table 2. Initial Reaction Rate at Various L-Ornithine L-Aspartate Concentrations (with [KMnO₄] and [NaOH] constants)
|
[L-Ornithine L-Aspartate] (mol/L) |
log C |
Initial Rate of Reaction (ΔA/min) |
log (ΔA/min) |
|
0.19 × 10⁻⁴ |
–4.725 |
0.75 × 10⁻² |
–2.217 |
|
0.56 × 10⁻⁴ |
–4.248 |
2.51 × 10⁻² |
–1.600 |
|
0.94 × 10⁻⁴ |
–4.026 |
3.91 × 10⁻² |
–1.407 |
|
1.31 × 10⁻⁴ |
–3.880 |
5.74 × 10⁻² |
–1.240 |
|
1.69 × 10⁻⁴ |
–3.770 |
6.72 × 10⁻² |
–1.173 |
|
2.07 × 10⁻⁴ |
–3.683 |
8.00 × 10⁻² |
–1.097 |
|
2.26 × 10⁻⁴ |
–3.645 |
9.05 × 10⁻² |
–1.04 |
The values for the endpoints of the initial rate and fixed time techniques were found to be 0.0828 g ml−1 and 0.2509 g ml−1 and 0.604 g ml−1, and 1.831 g ml−1, respectively. In the fixed time technique, a calibration graph was created by using the absorbance against beginning concentrations of L-ornithine-L-aspartate at a constant time of ten minutes [11]. The most favorable results for linearity, intercept, limit of detection, and quantitation were obtained when the measurements were taken at regular intervals of ten minutes. Consequently, ten minutes was shown to be the most efficient amount of time for the purpose of assessing L-ornithine L-aspartate in medical dosage forms.
Stability of the Solution
In order to find out how stable the test solution of L-ornithine-L-aspartate in distilled water was, the ultraviolet (UV) absorption spectra of L-ornithine-L-aspartate were measured over a period of three days. The medicine solution with the highest absorption at 212 and 243 nm did not exhibit any changes in its absorption spectra after a period of at least three days, or 72 hours, had passed since it was stored at room temperature and shielded from direct sunlight [12]. The stability experiments also included the green product that was produced by the oxidation of L-ornithine-L-aspartate with the application of alkaline KMnO4. The product showed no indications of instability over a time period of thirty-six hours.
Robustness
Analytical conditions that are recommended for the detection of L-ornithine-L-aspartate in both pure and commercial forms are thought to be quite reliable. For each operational parameter, the techniques were put through their paces in order to verify and question the robustness of the approaches. The following operational resilience factors were examined in this study: 1.0 M NaOH volume and 0.009 M KMnO4 volume
The initial rate and fixed time methodologies were used for the purpose of carrying out the five distinct research [13]. The samples were collected from a product that is available on the market and includes active L-ornithine-L-aspartate. The data indicated significant recovery based on the standard deviation, relative standard deviation, and mean recovery, as well as a high degree of sensitivity. What this implies is that the circumstances of the recommended strategies are completely reliable.
Selectivity
We were able to evaluate the selectivity of the proposed techniques by examining the concentration of L-ornithine-L-aspartate in the presence of common excipients, including magnesium stearate, lactose, silicon dioxide, and cellulose. The finding [14] indicates that there was no perceptible impact made by the excipients.
Precision and Accuracy
The accuracy and precision of the proposed processes were assessed by conducting daily measurements of the L-ornithine L-aspartate content over a period of five consecutive days at three different concentration levels: low, medium, and high. By obtaining five different measurements at concentration levels of 5.0, 35.0, and 60.0 g ml−1 in the span of a single day, the assay was performed, sometimes referred to as the daily precision or the intraday assay. The interday assay, which is often referred to as the within-day precision, was performed by obtaining five distinct measurements on five different days at the identical concentration levels. The results of the tests conducted to measure the intraday and interday precision of the beginning rate and fixed time methods, as well as the standard deviation, relative standard deviation, and mean recoveries, are all shown in Table 3. The results are satisfactory and fulfill the requirements for approval. In order to verify that the recommended techniques were practical, recovery experiments were also carried out using the typical addition method [15]. Five studies were performed in line with the accepted methodologies for the evaluation of active drug content in order to accomplish this. Each of these tests was an exact copy of the others. Preanalyzed dosage forms were then treated with a specified amount of the pure substance at three different concentration levels. As seen in Table 4, the results provided demonstrated excellent recoveries (98.80–101.0%) that were within acceptable relative standard deviation values. Furthermore, there is a strong indication from the data that there was no interaction between the common ingredients of the pills. An attractive feature of this method is the lack of conventional tablet diluents and excipients at concentrations that are higher than those that are commonly seen in pharmaceutical preparations.
Table 3. Assessment of the Suggested Methods' Accuracy and Precision Using Intraday and Interday Assays
|
Proposed Method |
Assay Type |
Amount Taken (µg/mL) |
Amount Found ± SDa |
RSD (%) |
SAEb |
CLc |
|
Initial Rate |
Intraday |
5 |
4.99 ± 0.05 |
1.02 |
0.023 |
0.06 |
|
35 |
35.01 ± 0.29 |
0.83 |
0.129 |
0.36 |
||
|
60 |
59.71 ± 0.90 |
1.51 |
0.403 |
1.12 |
||
|
Interday |
5 |
5.04 ± 0.08 |
1.61 |
0.036 |
0.10 |
|
|
35 |
34.83 ± 0.29 |
0.83 |
0.129 |
0.36 |
||
|
60 |
60.01 ± 1.01 |
1.68 |
0.452 |
1.25 |
||
|
Fixed Time |
Intraday |
5 |
4.98 ± 0.04 |
0.86 |
0.019 |
0.05 |
|
35 |
35.06 ± 0.41 |
1.18 |
0.185 |
0.51 |
||
|
60 |
60.58 ± 0.60 |
0.98 |
0.266 |
0.73 |
||
|
Interday |
5 |
5.01 ± 0.09 |
1.77 |
0.039 |
0.11 |
|
|
35 |
35.06 ± 0.60 |
1.73 |
0.271 |
0.75 |
||
|
60 |
60.05 ± 0.89 |
1.48 |
0.397 |
1.10 |
The Methods' Potential Use
The initial rate technique, as well as the fixed time approach, was successfully used in the determination of parenteral dosage forms and synthetic mixes of L-ornithine-L-aspartate [16]. The data obtained by the validation procedure were within the limits that were established by international regulatory standards. Consequently, we are aware of the fact that the procedures that have been recommended are successful and provide outcomes that are satisfying.
Table 4. Pharmacological Formulation and Synthetic Mixture L-Ornithine L-Aspartate Standard Addition Method
|
Method |
Formulation / Mixture |
Taken (µg/mL) |
Added (µg/mL) |
Found ± SDa (µg/mL) |
Recovery (%) |
SAEb |
CL |
|
Initial Rate |
Satmax (Venus Remedies Limited) |
10 |
5 |
15.12 ± 0.21 |
100.80 |
0.095 |
0.26 |
|
30 |
5 |
34.99 ± 0.16 |
99.97 |
0.073 |
0.20 |
||
|
50 |
5 |
54.34 ± 0.77 |
98.80 |
0.345 |
0.96 |
||
|
Fixed Time |
Satmax (Venus Remedies Limited) |
10 |
5 |
14.84 ± 0.21 |
98.96 |
0.092 |
0.26 |
|
30 |
5 |
35.06 ± 0.53 |
100.17 |
0.238 |
0.66 |
||
|
50 |
5 |
54.55 ± 0.86 |
99.76 |
0.386 |
1.07 |
||
|
Initial Rate |
Synthetic Mixture |
10 |
5 |
14.91 ± 0.18 |
99.45 |
0.078 |
0.21 |
|
30 |
5 |
35.02 ± 0.37 |
100.08 |
0.167 |
0.46 |
||
|
50 |
5 |
55.25 ± 1.00 |
100.46 |
0.450 |
1.24 |
||
|
Fixed Time |
Synthetic Mixture |
10 |
5 |
14.88 ± 0.20 |
99.23 |
0.090 |
0.25 |
|
30 |
5 |
35.35 ± 0.61 |
101.00 |
0.272 |
0.76 |
||
|
50 |
5 |
55.03 ± 0.80 |
100.05 |
0.359 |
1.0 |
Conclusion
When it comes to the determination of L-ornithine L-aspartate in its pure form and in commercial pharmaceutical formulations, such as injections and synthetic combinations, the established starting rate and fixed-time spectrophotometric techniques offer a straightforward, precise, and sensitive approach. These methods provide a low-cost and rapid alternative to the limited analytical techniques that are detailed in the literature; they also do not need extensive sample preparation or time-consuming cleaning procedures. The accuracy, precision, and reproducibility of the validated techniques allow research laboratories, hospitals, and pharmaceutical businesses to make use of them for routine quality control analysis with confidence. The proposed spectrophotometric methods may prove to be reliable tools in the ordinary process of assessing L-ornithine L-aspartate in various dosage forms.
- Sharma, B. C, Garg, H. (2014). Management of hepatic encephalopathy. Indian Journal of Gastroenterology. 33(1): 5–12.
- Butterworth, R. F. (2015). The neurobiology of hepatic encephalopathy. Seminars in Liver Disease. 35(2): 118–126.
- Patel, J, Desai, T, Shah, D. (2019). Development and validation of analytical methods for pharmaceutical analysis. Journal of Pharmaceutical Research. 18(3): 142–150.
- Rao, P, Kumar, R, Singh, S. (2020). UV–Visible spectrophotometry: A simple tool in pharmaceutical analysis. International Journal of Pharmaceutical Sciences Review and Research. 64(1): 35–42.
- J. Mendham, R. C. Denney, J. D. Barnes, and M. J. K. Thomas. (2002). Vogel’s Textbook of Quantitative Chemical Analysis, 6th edn., Pearson Education, Singapore. 420.
- S. Riahi, F. Hadiloo, S. M. R. Milani, N. Davarkhah, M. R. Ganjali, P. Norouzi, and P. Seyfi. (2011). Drug Testing Analysis. 3: 319.
- J. V. Patel, C. N. Patel, I. S. Anand, P. U. Patel, and P. H. Prajapati. (2008). Int. J. Chem. Sci. 6: 73.
- F. A. Ibrahim, F. A. Ali, S. M. Ahmed, and M. M. Tolba. (2007). Int. J. Biomed. Sci. 3(1): 20-30.
- B. S. Virupaxappa and K. H. Shivaprasad. (2011). Int. J. Chem. Res. 2: 21.
- J. Feher, I. Lang, A. Gogl, L. Varga, G. Tampos, and L. Pronia. (1997). Med. Sci. Monit. 3: 669.
- G. Kircheis, M. Wettstein, S. Dahl, and D. Häussinger. (2002). Metabolic Brain Dis. 17: 453.
- S. K. Acharya, V. Bhatia, S. K. Sreenivas, and S. K. Panda. (2009). Gastroenterology. 136: 2159-2168.
- Y. Kim, S. Haam, Y. G. Shul, W.-S. Kim, and J. K. Jung. (2003). Ind. Eng. Chem. Res. 42: 883.
- P. Kowalski, M. Bieniecki, I. Oledzka, and H. Lamparczyk. (2006). Biomed. Chromatogr. 20(2): 185-194.
- N. Rahman, M. R. Siddiqui, and S. N. H. Azmi, J. (2006). Chinese Chem. Soc. 53: 735.
- N. Rahman, N. Anwar, M. Kashif, M. N. Hoda, and H. Rahman, J. (2011). Mexican Chem. Soc. 55: 105.
Download Provisional PDF Here
PDF




p (1).png)


.png)


.png)
