

p (1).png)


.png)


.png)

Research Article
Calibration of High-Purity Germanium Detector Efficiency Using Standard Charcoal Canister Resources
- Shafaei, Mohammad Ali
Corresponding author: Shafaei, Mohammad Ali, Faculty of Physics, Yazd University, Pejohesh Blvd, Yazd, Iran, P. O. Box: 89195-741
Volume: 2
Issue: 4
Article Information
Article Type : Research Article
Citation : Shafaei, MohammadAli, Shafaei, Ali, Calibration of High-Purity Germanium Detector Efficiency Using Standard Charcoal Canister Resources. Journal of Medicine Care and Health Review 2(4). https://doi.org/10.61615/JMCHR/2025/OCT027141013
Copyright: © 2025 Shafaei, MohammadAli. This is an open-access article distributed under the terms of the Creative Commons Attribution License, which permits unrestricted use, distribution, and reproduction in any medium, provided the original author and source are credited.
DOI: https://doi.org/10.61615/JMCHR/2025/OCT027141013
Publication History
Received Date
03 Sep ,2025
Accepted Date
17 Sep ,2025
Published Date
13 Oct ,2025
Abstract
To determine the activity of radon progeny in the environment, it is necessary to establish a calibration curve for a high-purity germanium (HPGe) detection system using gamma rays in the energy range of 352 keV to 609 keV. Therefore, in this study, gamma radioactive sources with known activity were used to obtain the efficiency calibration curve of the HPGe detector. The sources used in this experiment were charcoal canisters doped with specific activities of radioactive elements such as Eu-152, Ba-133, Cs-137, and Am-241. By calculating the initial activity at the time of source preparation (A0) and knowing the time interval between the preparation of the standard source and its counting in the detector, the current activity of the source was calculated. By measuring the activity of the gamma-emitting sources using the detector and determining the efficiency factor as a function of the energy of each gamma-emitting source, an applicable efficiency equation as a function of gamma-ray energy can be derived, allowing the detector to be calibrated based on the efficiency factor at the desired gamma-ray energy.
Keywords: Activity, Calibration, Efficiency, High-Purity Germanium, Charcoal Canister
►Calibration of High-Purity Germanium Detector Efficiency Using Standard Charcoal Canister Resources
Shafaei, MohammadAli*1, Shafaei, Ali1
1*Faculty of Physics, Yazd University, Pejohesh Blvd, Yazd, Iran, P. O. Box: 89195-741.
Introduction
Gamma-ray spectrometry using germanium detectors is a reliable technique widely employed to determine the activity concentration of natural and artificial radioactive elements in the environment. The most critical step in gamma spectrometry analysis is determining the number of photons emitted by the source and detected by the detector [1, 2]. The efficiency calibration of a high-purity germanium (HPGe) detector is typically performed using standard gamma sources that have the same geometry, density, and chemical composition as the samples under study [3, 4].
To analyze complex gamma spectra and express a spectrum in terms of activity or the quantity of radioactive elements, it is useful to have an analytical function that describes the detector's efficiency as a function of energy [5, 6]. Of paramount importance, however, is the Full Energy Peak Efficiency (FEEP), which, as indicated by the following equation, represents the ratio of the total gamma-ray counts in the full energy peak to the gamma-ray emission rate from the source, denoted by ԑ [7, 8].
 (1)
(1)
Where P is the probability of gamma decay of the radioactive nucleus, t is the spectroscopy duration (live time), and A is the number of decayed nuclei over time. By placing single-energy or composite sources with known energy and activity in front of the detector, counting the emitted gamma rays, and knowing the counting duration and decay probability, efficiency can be determined. By plotting the obtained efficiency values on an efficiency curve as a function of energy and fitting them, an equation for the efficiency calibration curve can be derived [7]. Finally, by placing a source with unknown activity in front of the detector and using the calibration curve equation, the activity of the source can be determined.
The sources used in this experiment are charcoal canisters, consisting of three main parts: two mesh caps (20% to 50% perforated) and a cylindrical middle section with two paper filters placed on it.
Methodology
The detector used in this experiment is a dual-sided HPGe semiconductor detector (GPD-50-400) with a diameter of 50 mm, a thickness of 15 mm, and a relative efficiency of 10%. The canisters are placed on the detector using a holder. To minimize errors in spectrum recording, the pulse shaping time is set to 5 microseconds, the gain to 0.484 keV/Channel, and the applied voltage to the detector is set at 3600 keV. The sources used in this experiment—Eu-152, Ba-133, Cs-137, and Am-241—have known activities and are added to charcoal canisters with the same dimensions and geometry as the samples. These sources cover an energy range between 60 and 1500 keV. By calculating the initial activity at the time of source preparation and considering a time interval of 14 years and two months between the preparation of the standard source and its current measurement in the detector, the present activity of the source is calculated using equation (2). The results are displayed in Table 1.
 (2)
(2)
Table 1. Activity of Standard Coal
|
RNU |
T1/2(Year) |
A0(kBq) |
A(kBq) |
|
Eu-152 |
13.6 |
1.7%±1.8 |
1.7%±1.6 |
|
Ba-133 |
10.51 |
1.9%±1.7 |
1.9%±1.5 |
|
Cs-137 |
30.17 |
1.8%±16.2 |
1.8%±15.4 |
|
Am-241 |
432.2 |
1.7%±17.4 |
1.7%±17.4 |
The error in the activity of the standard source can also be calculated using the laboratory error of the initial activity and by applying equation (3).
 (3)
(3)
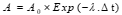
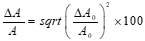
The sources are placed one by one on the detector using a holder, and their spectra are defined and recorded based on energy. Figures 1 and 2 illustrate the spectra of the sources used in this experiment.
Figure 1: Spectrum of Ba-133 and Cs-137 sources.
Figure 2: Spectrum of Eu-152 and Am-241 sources.
Results
After recording and saving the spectra of the standard sources, and with the activity of the radioactive elements available from Table 1, along with the counting duration, net area under the peaks, and decay probability, we can calculate the efficiency at different energies using equation (1). Variations in efficiency values across different energies are observed, which are attributed to the energy loss of the elements on the filter. With the activity of the radioactive element, counting duration, net area under the peaks, and decay probability known, efficiency at different energies can be calculated using equation (1). The variations in efficiency values at different energies are due to the energy loss of the respective element on the filter. A summary of this information is presented in Table 2.
Table 2: Efficiency of Standard Sources at Different Energies.
|
Efficiency % |
E(KeV) |
RUN |
|
1.72%±1.19 |
60 |
Am-241 |
|
1.81%±2.08 |
662 |
Cs-137 |
|
1.71%±4.95 |
122 |
Eu-152 |
|
1.73%±3.73 |
245 |
Eu-152 |
|
1.72%±3.09 |
344 |
Eu-152 |
|
1.83%±2.44 |
411 |
Eu-152 |
|
1.74%±1.57 |
779 |
Eu-152 |
|
1.83%±1.38 |
867 |
Eu-152 |
|
1.74%±137 |
964 |
Eu-152 |
|
1.75%±1.29 |
1112 |
Eu-152 |
|
1.74%±1.04 |
1408 |
Eu-152 |
|
1.97%±5.39 |
161 |
Ba-133 |
|
1.88%±4.30 |
276 |
Ba-133 |
|
1.87%±4.14 |
303 |
Ba-133 |
|
1.87%±3.63 |
356 |
Ba-133 |
|
1.87%±3.63 |
384 |
Ba-133 |
To calculate the efficiency error, we must first determine the error in the full-energy peak area values. This can be done using the following equation.
 (4)
(4)
Now, with the errors in the activity and the full-energy peak area determined, the efficiency errors at different energies can be calculated using equation 5.
 (5)
(5)
The goal of all these procedures is to derive an equation that can describe efficiency as a function of energy. The efficiency calibration curve is fitted with a polynomial function to ensure accurate and precise results.
 (6)
(6)
In this equation, P1 to P5 are the parameters of the fitted function. Using software like MATLAB, it is possible to calculate the fixed coefficients and derive a polynomial equation for point gamma-emitting sources. However, in this case, we use a direct approach with the software Table Curve. By considering energy as the horizontal axis and efficiency as the vertical axis, we obtain the efficiency curve and its equation as a function of energy (Figure 3). Through this process, by fitting a curve to the efficiency data, we arrive at a logarithmic equation (Equation 7) that describes efficiency as a function of energy.
y=(a+clnx+e(lnx)2)/(1+blnx+d(lnx)2) (7)
In this equation, a, b, c, and so on are constants with the following values.
a=-0.316, b=-0.40754, c=0.093, d=0.04248, e=-0.00077
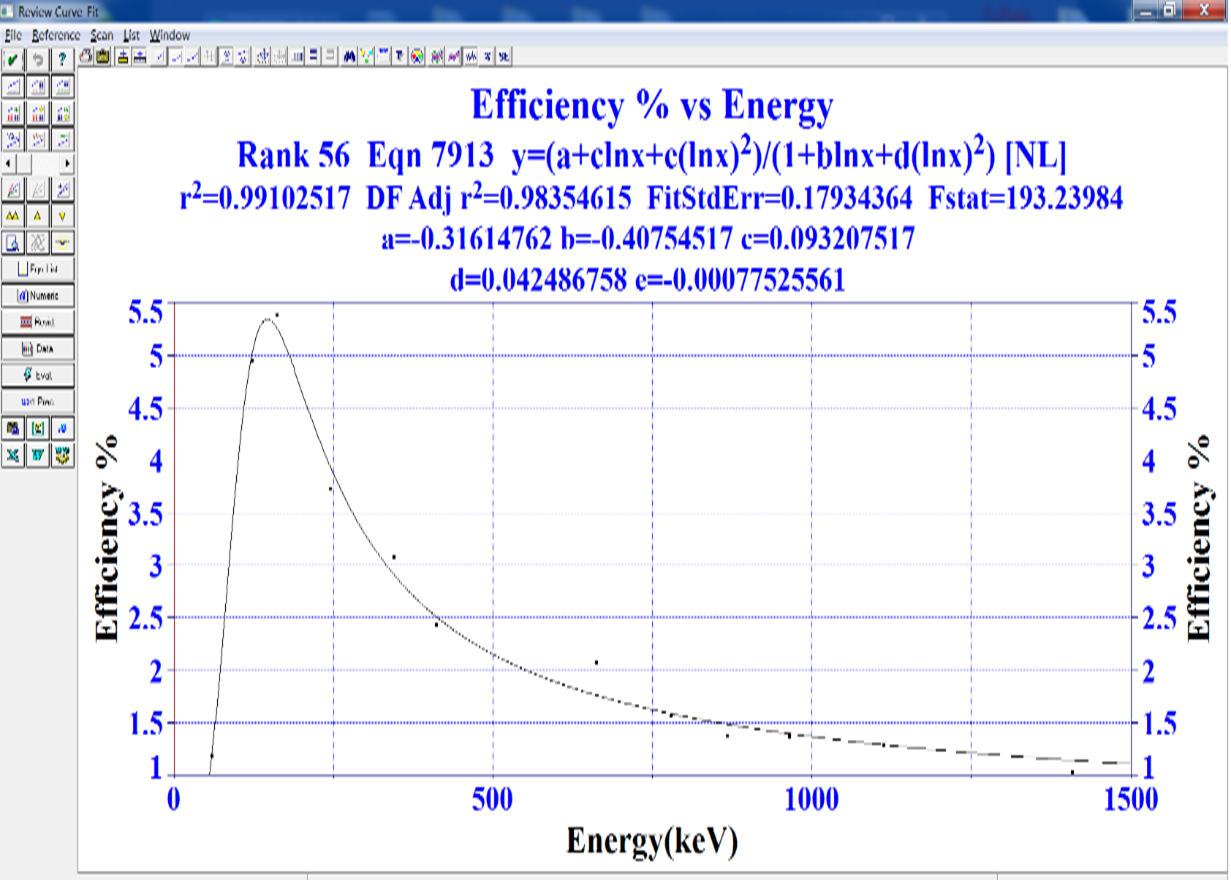
Figure 3: Efficiency calibration curve of the HPGe-Planar detector
The least squares method is available in most mathematical and statistical software. The error in these efficiency values has also been obtained by fitting using the least squares method and laboratory data in the software "TableCurve."
As shown in Figure 3, at low energies, the efficiency increases rapidly with rising energy. This is due to the sudden reduction in the decay of the radioactive source at the end of the detector chamber or the internal dead layer of the detector. The maximum observed occurs at certain energies, which depend on the relative characteristics of the detector and the source.
To evaluate the activity in various samples, we first define the energies corresponding to each peak or channel through energy calibration. Then, with the net area under the peak and the energy value inserted into equation (1), we can calculate the efficiency of the elements present in the sample at different energies. Given the measurement duration, decay probability, and efficiency, we can calculate the activity of the corresponding element at a specific energy using equation (8).
 (8)
(8)
Discussion and Conclusion
The efficiency calibration of the detection system was carried out using standard sources with dimensions matching those of the samples. By defining the efficiency equation as a function of energy and substituting the energies of 609 keV and 352 keV into this equation, the obtained efficiencies are 1.87 ± 0.18% and 2.87 ± 0.18%, respectively. Consequently, a mathematical model was developed and tested using software tools to calculate the efficiency equation for the HPGe detector. To minimize errors in this model, necessary correction equations were applied to improve the accuracy of the obtained values, and efficiency values for lower gamma energies were also computed.
Ultimately, with the energy efficiency calculation method and the proposed mathematical model, the procedure can be easily applied across any energy range to determine the concentration of the substance based on the measured gamma energy spectrum. Modern detectors in advanced countries are lightweight and portable, providing instant measurements of radon concentration in the environment. With these relationships, detectors can also be designed to calculate the instantaneous activity of radon.
- Nicholas Tsoulfanidis, Measurement and Detection of Radiation, Crc Press. (2013).
- Díaz-Asencio M. (2020). Calibration and use of well-type germanium detectors for low-level gamma-ray spectrometry of sediments using a semi-empirical method, Journal of Environmental Radioactivity. 225: 106385.
- Detection efficiency Marie-Christine Lépy Laboratoire National Henri Becquerel CEA Saclay, F-91191 Gif-sur-Yvette cedex, France, IAEA - ALMERA Technical Visit. 2010.
- Maurice, M. (2018). Modeling a HPGe detector's absolute efficiency as a function of gamma energy and soil density in uncontaminated soil, Journal of Earth Science & Environmental Studies.
- American National Standard for Calibration and Use of Germanium Spectrometers for Measurement of Gamma-Ray Emission Rates of Radionuclides, ANSI N42.14, IEEE, Inc. NY, (1978).
- Mabit, L,Blake W. (2019). Assessing Recent Soil Erosion Rates through the Use of Beryllium-7 (Be-7).
- Maurice, M. (2018). Modeling a HPGe detector's absolute efficiency as a function of gamma energy and soil density in uncontaminated soil, Journal of Earth Science & Environmental Studies.
- Zhang J. (2024). The full-energy peak efficiency of gamma-ray spectrometry by numerical calculation method.
- Germanium Detectors User's Manual (9231358b), (2003).
Download Provisional PDF Here
PDF